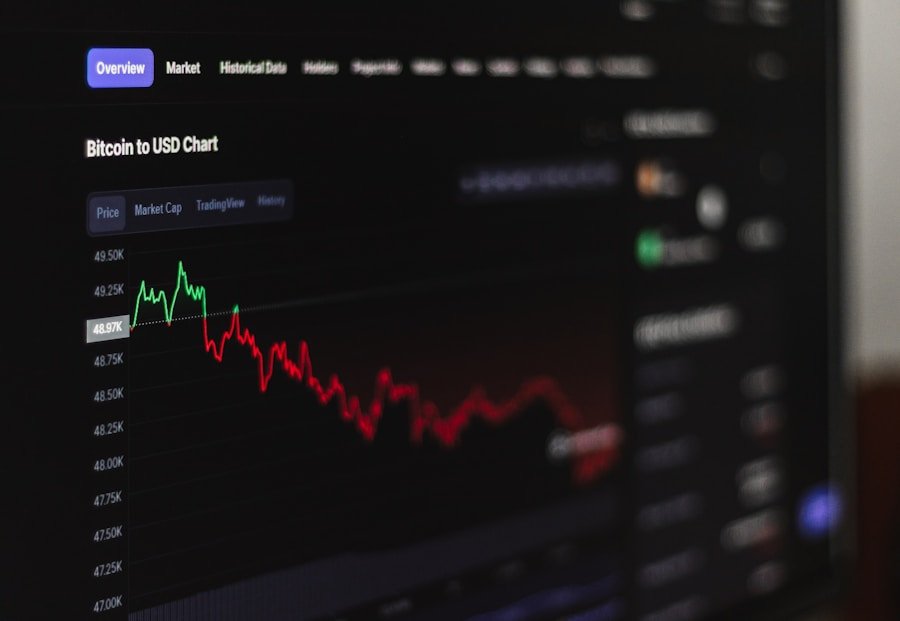
Technical analysis is a method used by traders and investors to evaluate and forecast the future price movements of financial assets, such as stocks, currencies, and commodities. This analysis is based on the premise that historical price data, trading volume, and other market statistics can be used to predict future price movements. Technical analysts believe that all relevant information about an asset is already reflected in its price and that by analyzing past price movements, they can identify patterns and trends that can help them make informed trading decisions.
One of the key principles of technical analysis is the idea that price movements tend to follow trends. This means that once a trend is established, it is likely to continue in the same direction until there is a significant change in market conditions. Technical analysts use various tools and techniques to identify and analyze trends, such as moving averages, trend lines, and chart patterns. By understanding and recognizing these trends, traders can make more accurate predictions about future price movements and take advantage of potential trading opportunities.
Identifying Trends and Patterns
Identifying trends and patterns is a crucial aspect of technical analysis. Trends are the general direction in which an asset’s price is moving over a period of time. There are three main types of trends: uptrend, downtrend, and sideways trend. An uptrend is characterized by higher highs and higher lows, indicating that the price is generally increasing over time. A downtrend, on the other hand, is marked by lower highs and lower lows, signaling a general decrease in price. A sideways trend occurs when the price moves within a relatively narrow range without any clear direction.
In addition to identifying trends, technical analysts also look for patterns in price movements that can provide valuable insights into future price movements. Some common chart patterns include head and shoulders, double tops and bottoms, triangles, and flags. These patterns can help traders anticipate potential trend reversals or continuation patterns, allowing them to make more informed trading decisions. By understanding and recognizing these trends and patterns, traders can gain a better understanding of market dynamics and improve their ability to predict future price movements.
Utilizing Indicators and Oscillators
Technical analysts use a variety of indicators and oscillators to help them analyze market trends and identify potential trading opportunities. Indicators are mathematical calculations based on historical price data that can help traders gauge the strength and direction of a trend. Some popular indicators include moving averages, relative strength index (RSI), stochastic oscillator, and MACD (moving average convergence divergence). These indicators can provide valuable insights into market dynamics and help traders make more informed trading decisions.
Oscillators are another important tool used in technical analysis to identify overbought or oversold conditions in the market. Oscillators measure the momentum of price movements and can help traders identify potential trend reversals or continuation patterns. Some common oscillators include the RSI, stochastic oscillator, and the Williams %R. By utilizing these indicators and oscillators, traders can gain a better understanding of market dynamics and improve their ability to identify potential trading opportunities.
Applying Support and Resistance Levels
Support and resistance levels are key concepts in technical analysis that can help traders identify potential entry and exit points for their trades. Support levels are price levels at which a financial asset tends to find buying interest, preventing the price from falling further. Resistance levels, on the other hand, are price levels at which a financial asset tends to encounter selling pressure, preventing the price from rising further. By identifying these key levels, traders can anticipate potential price movements and make more informed trading decisions.
Support and resistance levels can be identified using various technical analysis tools, such as trend lines, moving averages, and chart patterns. Once these levels are identified, traders can use them to set stop-loss orders, take-profit targets, or even to enter or exit trades. By applying support and resistance levels in their trading strategies, traders can improve their ability to manage risk and maximize their potential profits.
Implementing Moving Averages
Moving averages are one of the most widely used technical indicators in technical analysis. A moving average is a trend-following indicator that smooths out price data by creating a constantly updated average price over a specific period of time. There are different types of moving averages, such as simple moving averages (SMA) and exponential moving averages (EMA). Traders use moving averages to identify trends, confirm trend reversals, and generate buy or sell signals.
Traders often use moving averages in combination with other technical indicators to confirm potential trading opportunities. For example, a common strategy is to use a short-term moving average crossing above a long-term moving average as a buy signal, while a short-term moving average crossing below a long-term moving average can be used as a sell signal. By implementing moving averages in their trading strategies, traders can gain valuable insights into market trends and improve their ability to make informed trading decisions.
Using Fibonacci Retracement
Fibonacci retracement is a popular tool used in technical analysis to identify potential support and resistance levels based on the Fibonacci sequence. The Fibonacci sequence is a series of numbers where each number is the sum of the two preceding ones (0, 1, 1, 2, 3, 5, 8, 13, 21, etc.). Traders use Fibonacci retracement levels to identify potential price reversals or continuation patterns based on these key levels.
Fibonacci retracement levels are drawn by connecting a significant low to a significant high or vice versa using horizontal lines at key Fibonacci levels (23.6%, 38.2%, 50%, 61.8%, and 100%). These levels can act as potential support or resistance levels where traders can anticipate potential price movements. By using Fibonacci retracement in their technical analysis, traders can gain valuable insights into potential price reversals or continuation patterns and improve their ability to make more informed trading decisions.
Monitoring Volume and Liquidity
Volume and liquidity are important factors that technical analysts consider when analyzing market trends and identifying potential trading opportunities. Volume refers to the number of shares or contracts traded in a particular financial asset over a specific period of time. High volume often indicates strong market interest in an asset, while low volume may suggest weak market interest or lack of conviction.
Liquidity refers to how easily an asset can be bought or sold without causing significant price movements. Highly liquid assets tend to have tight bid-ask spreads and high trading volumes, making it easier for traders to enter or exit positions without significantly impacting the market price. By monitoring volume and liquidity, traders can gain valuable insights into market dynamics and improve their ability to identify potential trading opportunities.
In conclusion, technical analysis is a valuable tool that traders and investors use to analyze market trends and identify potential trading opportunities. By understanding technical analysis principles such as identifying trends and patterns, utilizing indicators and oscillators, applying support and resistance levels, implementing moving averages, using Fibonacci retracement, and monitoring volume and liquidity, traders can gain valuable insights into market dynamics and improve their ability to make more informed trading decisions. While technical analysis is not without its limitations, it remains an essential tool for traders looking to gain a better understanding of market trends and improve their ability to identify potential trading opportunities.


